
Determining the level of cellular fluorescence from fluorescence microscopy images in ImageJ

- Open ImageJ. Note: ImageJ may be freely downloaded from here
- Select the cell of interest using any of the drawing/selection tools (i.e. rectangle, circle, polygon or freeform)
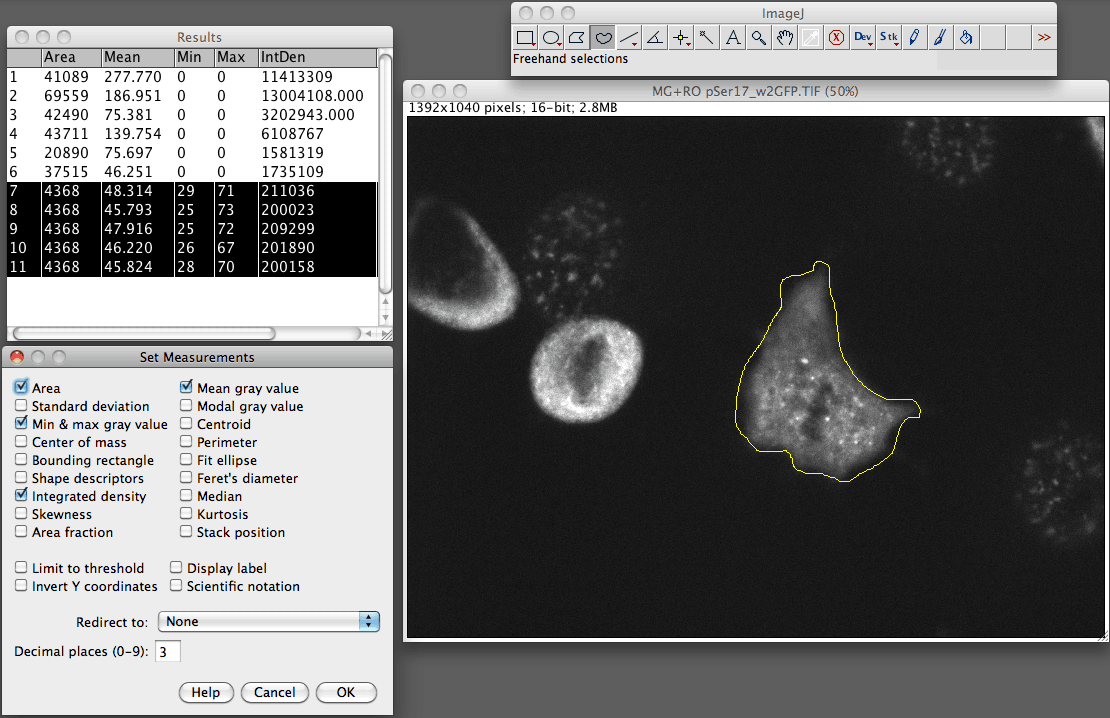
- From the Analyze menu select “set measurements”. Make sure you have area integrated intensity and mean grey value selected (the rest can be ignored).
- Now select “Measure” from the analyze menu. You should now see a popup box with a stack of values for that first cell.
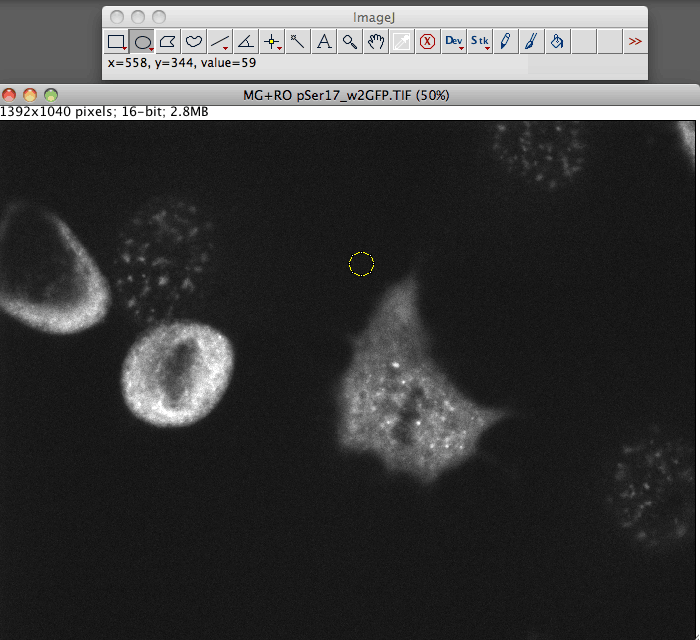
- Now go and select a region next to your cell that has no fluorescence, this will be your background.
Repeat this step for the other cells in the field of view that you want to measure.
Size is not important. If you want to be super accurate here take 3+ selections from around the cell.
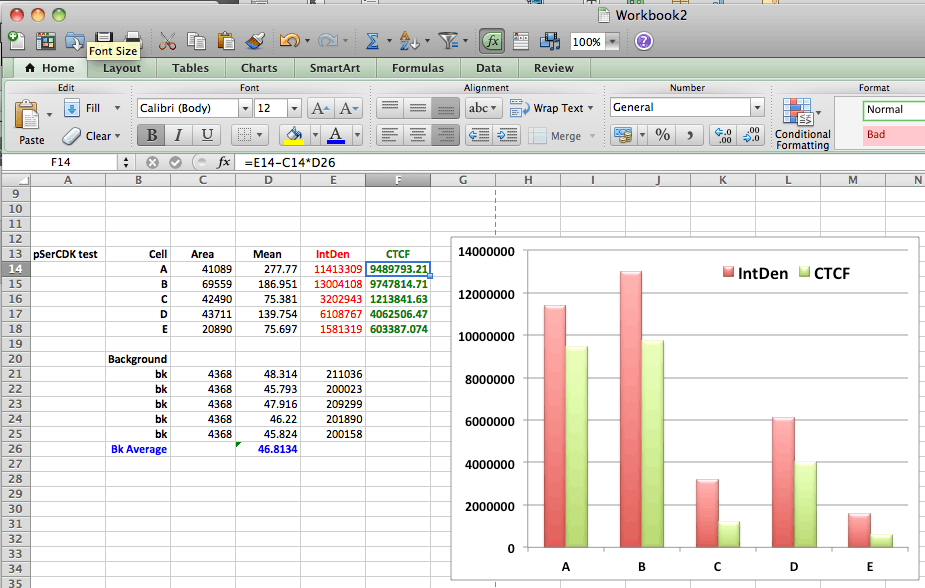
- Once you have finished, select all the data in the Results window and copy and paste into a new spreadsheet (or similar program)
- Use this formula to calculate the corrected total cell fluorescence (CTCF).
CTCF = Integrated Density – (Area of selected cell X Mean fluorescence of background readings)
- Make a graph and your done.
Notice that rounded up mitotic cells appear to have a much higher level of staining due to its smaller size concentrating the staining in a smaller space. If you used the raw integrated density you would have data suggesting that the flattened cell has less staining then the rounded up one, when in reality they have a similar level of fluorescence.

To support developers in [[ countryRegion ]] I give a [[ localizedDiscount[couponCode] ]]% discount on all books and courses.
[[ activeDiscount.description ]] I'm giving a [[ activeDiscount.discount ]]% discount on all books and courses.