
I've just released a simple API for managing matplotlib line and marker styles for plots. It's called mplstyler and you can get it from Github or PyPi. This code is based on the style manager in Pathomx, extracted for more general use.
from mplstyler import StylesManager
styles = StylesManager()
from pylab import *

x = linspace(0, 5, 10)
y1 = x ** 2
y2 = x ** 3
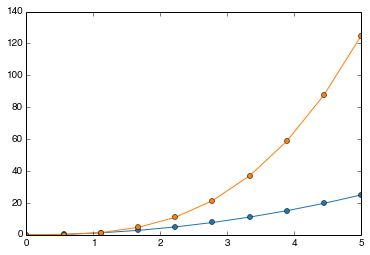
figure()

s = styles.get_style_for_class('Series 1')
plot(x, y1, **s.kwargs)

s = styles.get_style_for_class('Series 2')
plot(x, y2, **s.kwargs)

show()
figure()

from collections import OrderedDict

l = OrderedDict()
s = styles.get_style_for_class('Series 1')
l['Series 1'] = bar(x, y1, **s.bar_kwargs)

s = styles.get_style_for_class('Series 3')
l['Series 3'] = bar(max(x)+x, y2, **s.bar_kwargs)

leg = legend(l.values(), l.keys(),
   loc='best')
leg.get_frame().set_facecolor('k')
leg.get_frame().set_alpha(0.05)


show()
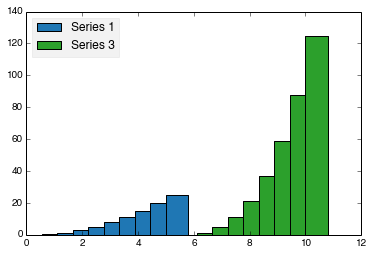
Notice that Series 1 has again been displayed using the same colour, since the classname ('Series 1') is unchanged. However, Series 3 is assigned a new colour as it doesn't match any of the previous classes.
You can manually set styles and use pattern matching (regex) to cumulatively build styles. Documentation for all of this will follow shortly once the API is more settled. A Qt UI for editing and configuring style behaviour (as seen in Pathomx) will also be available.

To support developers in [[ countryRegion ]] I give a [[ localizedDiscount[couponCode] ]]% discount on all books and courses.
[[ activeDiscount.description ]] I'm giving a [[ activeDiscount.discount ]]% discount on all books and courses.