Qt Designer is a great tool for designing PyQt5 GUIs, allowing you to use the entire range of Qt5 widgets and layouts to construct your apps. As your applications get more complex however you may find yourself creating custom widgets, or using PyQt5 libraries such as PyQtGraph, who's widgets are not available within Designer.
Helpfully, Qt Designer supports a mechanism for using placeholder widgets to represent your custom or external widgets in your design. This tutorial will walk you through the process of using placeholders to include a PyQtGraph plot in your app from within Qt Designer.
Promoting Widgets
The principle of using placeholders in Qt Designer is quite straightforward —
- Create a UI as normal in Qt Designer.
- Add a placeholder widget to represent the custom widget you're adding.
- Tell Qt to replace your placeholder with your actual widget when building the UI.
In Qt this final step is referred to as promoting (as in promoting a base class).
If the custom widget you are adding is a subclass of an existing Qt widget, you may want to use the base class as your placeholder to promote from. For example, if you have a custom MyAwesomeButton button widget subclassed from QPushButton use QPushButton as the placeholder and promote it to MyAwesomeButton. This gives you access to the base class properties, events and actions from within Qt Designer.
If you don't have an obvious base class to use, then you can use QWidget, the common base class of all Qt widgets.
PyQtGraph
Data science is one of the post popular uses of Python, and building dashboards and analysis tools is a common use case of PyQt5. For all of these being able to add plots to your UI is very useful — and being able to do this from Qt Designer even more so.
There are a number of plotting libraries available in Python, with matplotlib being the most popular and offering some basic support for PyQt5. PyQtGraph is an popular alternative which uses Qt's native QGraphicsScene to provide fast zooming, scaling, drag-drop behaviour that feels a natural part of your application.
Whether you're using PyQtGraph or maplotlib for your plotting needs, the plot canvas widgets are not available from within Qt Designer. In this tutorial I'll walk you through the process of using these custom widgets in your apps.
If you don't have PyQtGraph installed already, you can install it using:
pip install pyqtgraph
The instructions below aren't specific to PyQtGraph, and you can use the same process to add matplotlib or any other custom widgets to your app.

Also available from Leanpub and Amazon Paperback
Purchasing Power Parity
Developers in [[ country ]] get [[ discount.discount_pc ]]% OFF on all books & courses with code [[ discount.coupon_code ]]Qt Designer
We will be using Qt Designer to create a simple UI design, and adding a placeholder for our PyQtGraph widget. First open Qt Designer and create a new QMainWindow as normal.
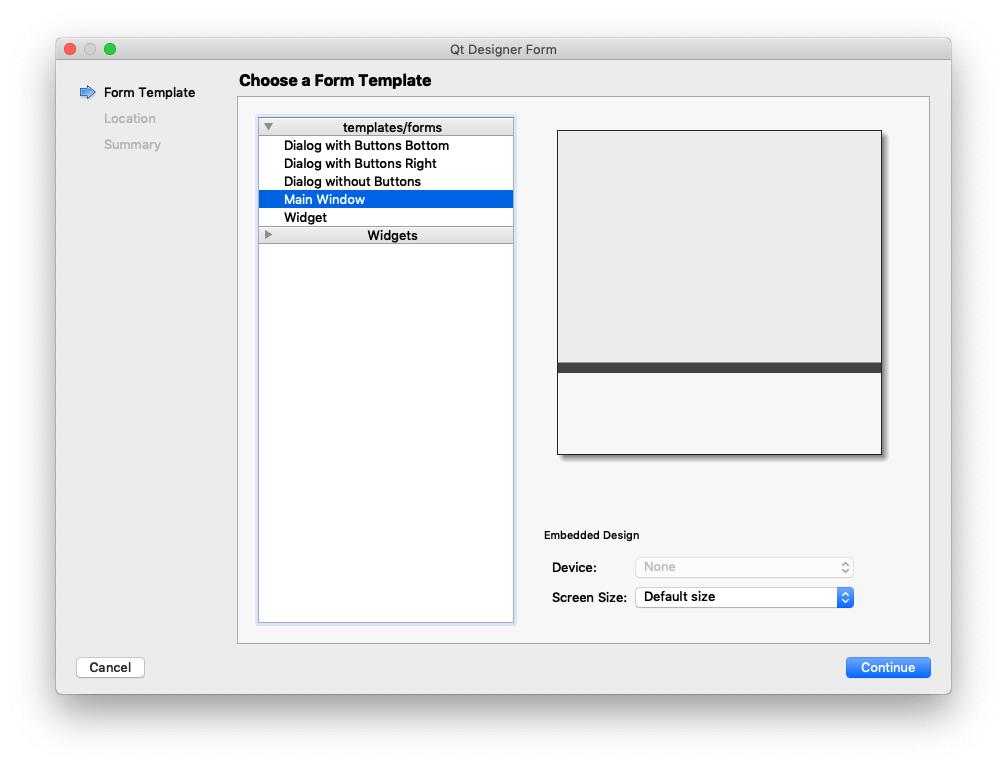 Qt Creator — Select MainWindow for widget type
We next need to add the placeholder widget. As there is no suitable baseclass for the PyQtGraph plot widget, we'll use the basic QWidget as our placeholder. Select the Widget from the left sidebar and place it in the centre of your window.
Give the widget a name, "graphWidget" will do. This is just a tag to reference the element in code.
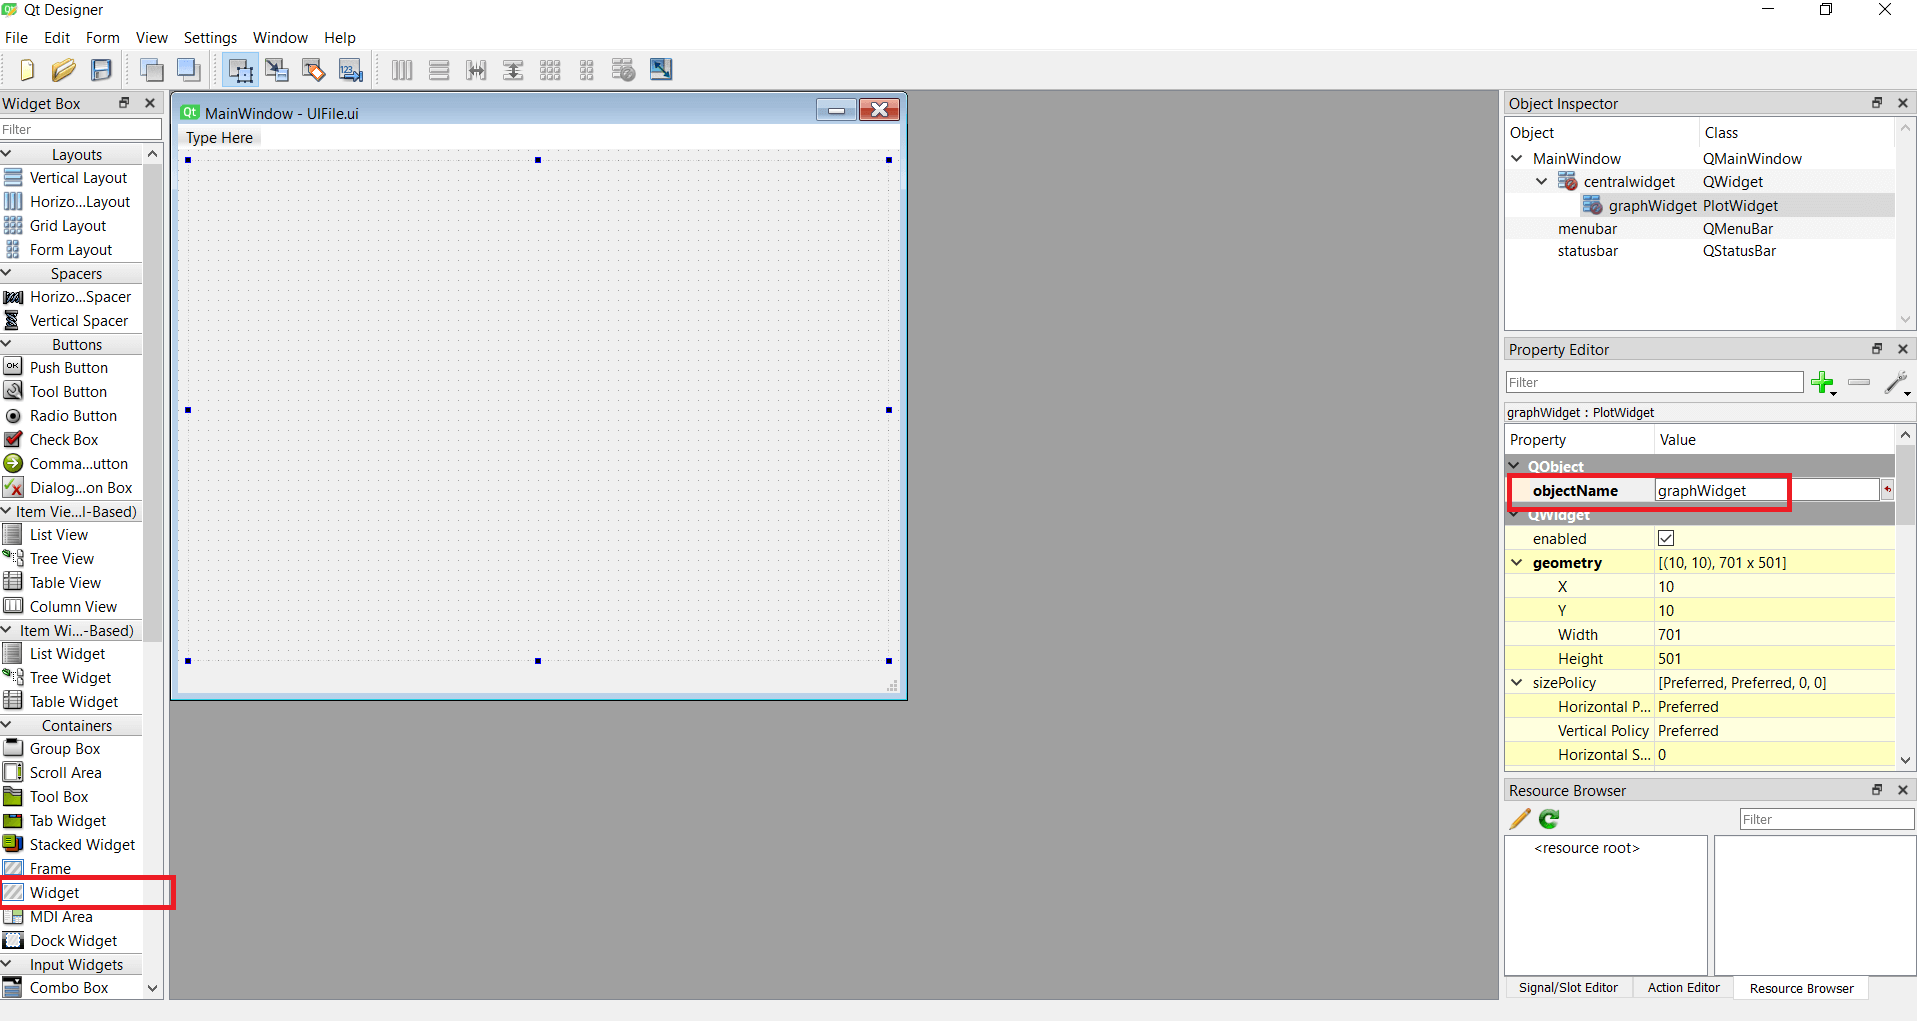 Add a widget to the window. Name the widget as "graphWidget"
Right click on the widget and select Promote to from the widget's context menu.
Promoting a QWidget indicates that it should be replaced with the specified subclass, in our case the PyQtGraph plot widget.
A promoted widget can be reverted back to its base class by right-clicking and choosing Demote to from the widget's context menu.
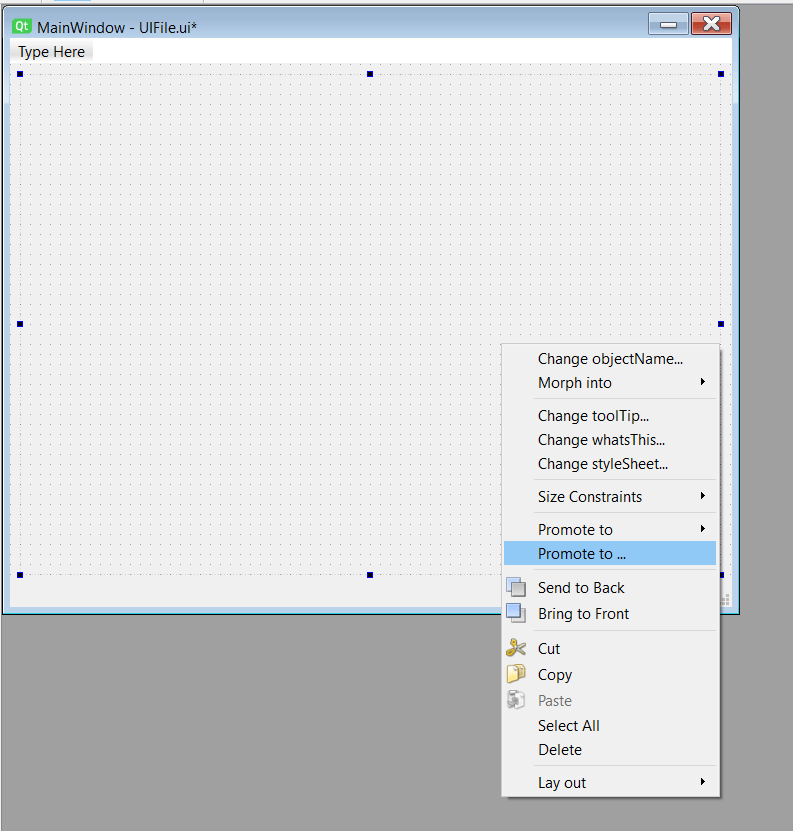 Right click to show the promotion menu
You will be presented with a dialog to specify the custom widget class the placeholder widget will become.
The header file is the name of the Python module used to import the class, which is pyqtgraph. Specify PlotWidget as the class name of the widget to replace it with.
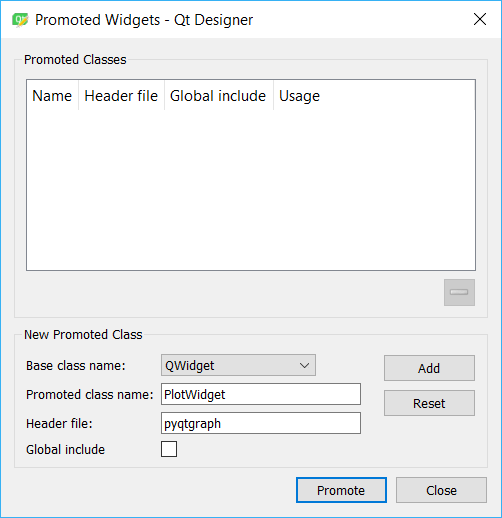 Promote the widget by specifying the class name as PlotWidget and header file as pyqtgraph.
The name you use for the file doesn't matter, but it's usually a good idea to name it after the class you're going to create with it.
Voila! The widget is now promoted to a canvas to plot. But you won't be able to see any changes within Qt Designer. Save the window as mainwindow.ui in the same directory as your PyQt app.
For a complete guide to using Qt Designer .ui files from Python check out First steps with Qt Creator.
Loading the .ui file
We now have the mainwindow.ui file containing our UI definition. We can load this from Python to show the window and our custom widget.
Let's start from a basic app template.
from PyQt5 import QtWidgets, uic
from pyqtgraph import PlotWidget
import pyqtgraph as pg
import sys

class MainWindow(QtWidgets.QMainWindow):

    def __init__(self, *args, **kwargs):
        super(MainWindow, self).__init__(*args, **kwargs)

        #Load the UI Page
        uic.loadUi('mainwindow.ui', self)


def main():
    app = QtWidgets.QApplication(sys.argv)
    main = MainWindow()
    main.show()
    sys.exit(app.exec_())

if __name__ == '__main__':
    main()
Save the code above in the same folder as your mainwindow.ui file, and run it as normal.
python3 my_app.py
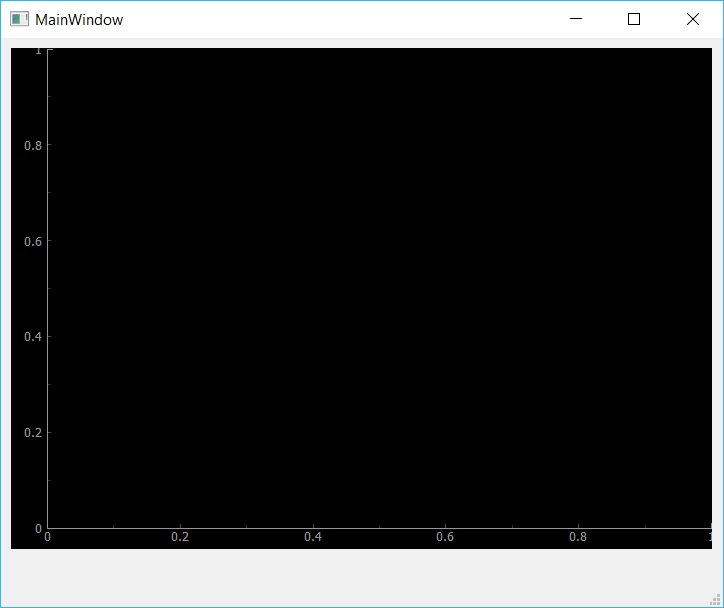 Your graph is now embedded
You should see a window with your widget transformed into a PyQtGraph plotting widget.
Let's now create a function to make a simple plot of x and y data.
from PyQt5 import QtWidgets, uic
from pyqtgraph import PlotWidget, plot
import pyqtgraph as pg
import sys  # We need sys so that we can pass argv to QApplication
import os

class MainWindow(QtWidgets.QMainWindow):

    def __init__(self, *args, **kwargs):
        super(MainWindow, self).__init__(*args, **kwargs)

        #Load the UI Page
        uic.loadUi('mainwindow.ui', self)

        self.plot([1,2,3,4,5,6,7,8,9,10], [30,32,34,32,33,31,29,32,35,45])

    def plot(self, hour, temperature):
        self.graphWidget.plot(hour, temperature)

def main():
    app = QtWidgets.QApplication(sys.argv)
    main = MainWindow()
    main.show()
    sys.exit(app.exec_())

if __name__ == '__main__':
    main()
So we added the plot() method which accepts two arrays, temp Temperature and hour Hour, then plots the data using the graph widget .plot() method.
Run the code, you should see the following.
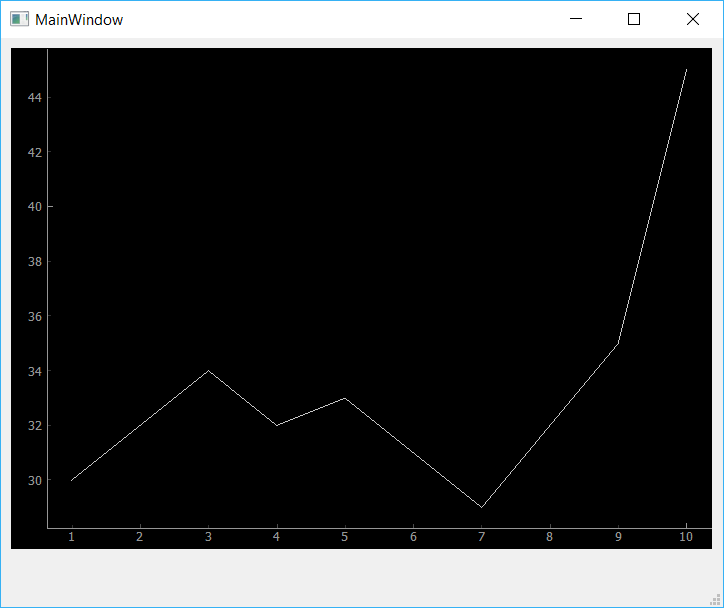 The custom PyQtGraph widget showing dummy data.
That's it! You have just embedded your first plot with PyQtGraph.
The default PyQtGraph plot isn't very pretty, however can play around with the .plot() call to change the data shown.
We'll cover more complex PyQtGraph plots and plot customization, including line colours, styles and alternative types of plots in an upcoming tutorial.
