In the previous tutorial we covered an introduction to the Model View architecture. However, we only touched on one of the model views — QListView. There are two other Model Views available in Qt5 — QTableView and QTreeView which provide tabular (Excel-like) and tree (file directory browser-like) views using the same QStandardItemModel.
In this tutorial we'll look at how to use QTableView from PySide, including how to model your data, format values for display and add conditional formatting.
You can use model views with any data source, as long as your model returns that data in a format that Qt can understand. Working with tabular data in Python opens up a number of possibilities for how we load and work with that data. Here we'll start with a simple nested list of list and then move onto integrating your Qt application with the popular numpy and pandas libraries. This will provide you with a great foundation for building data-focused applications.
Introduction to QTableView
QTableView is a Qt view widget which presents data in a spreadsheet-like table view. Like all widgets in the Model View Architecture, this uses a separate model to provide data and presentation information to the view. Data in the model can be updated as required, and the view notified of these changes to redraw/display the changes. By customising the model it is possible to have a huge amount of control over how the data is presented.
To use the model we'll need a basic application structure and some dummy data. A simple working example is shown below, which defines a custom model working with a simple nested-list as a data store.
We'll go into alternative data structures in detail a bit later.
import sys
from PySide2 import QtCore, QtGui, QtWidgets
from PySide2.QtCore import Qt


class TableModel(QtCore.QAbstractTableModel):
    def __init__(self, data):
        super(TableModel, self).__init__()
        self._data = data

    def data(self, index, role):
        if role == Qt.DisplayRole:
            # See below for the nested-list data structure.
            # .row() indexes into the outer list,
            # .column() indexes into the sub-list
            return self._data[index.row()][index.column()]

    def rowCount(self, index):
        # The length of the outer list.
        return len(self._data)

    def columnCount(self, index):
        # The following takes the first sub-list, and returns
        # the length (only works if all rows are an equal length)
        return len(self._data[0])


class MainWindow(QtWidgets.QMainWindow):
    def __init__(self):
        super().__init__()

        self.table = QtWidgets.QTableView()

        data = [
          [4, 9, 2],
          [1, 0, 0],
          [3, 5, 0],
          [3, 3, 2],
          [7, 8, 9],
        ]

        self.model = TableModel(data)
        self.table.setModel(self.model)

        self.setCentralWidget(self.table)


app=QtWidgets.QApplication(sys.argv)
window=MainWindow()
window.show()
app.exec_()
As in our earlier model view examples, we create the QTableView widget, then create an instance of our custom model (which we've written to accept the data source as a parameter) and then we set the model on the view. That's all we need to do — the view widget now uses the model to get the data, and determine how to draw it.
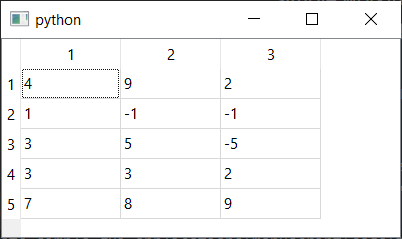 Basic QTableView example
Nested list as a 2-dimensional data store
For a table you need a 2D data structure, with columns and rows. As shown in the example above you can model a simple 2D data structure using a nested Python list. We'll take a minute to look at this data structure, and it's limitations, below —
table = [
  [4, 1, 3, 3, 7],
  [9, 1, 5, 3, 8],
  [2, 1, 5, 3, 9],
]
The nested list is a "list of lists of values" — an outer list containing a number of sub-lists which themselves contain the values. With this structure, to index into individual values (or "cells") you must index twice, first to return one of the inner list objects and then again to index into that list.
The typical arrangement is for the outer list to hold the rows and each nested list to contain the values for the columns. With this arrangement when you index, you index first by row, then by column — making our example table a 3 row, 5 column table. Helpfully, this matches the visual layout in the source code.
The first index into the table will return a nested sub-list —
row = 2
col = 4

>>> table[row]
[2, 1, 5, 3, 9]
Which you then index again to return the value —
>>> table[row][col]
9
Note that using this type of structure you can't easily return an entire column, you would instead need to iterate all the rows. However, you are of course free to flip things on their head and use the first index as column depending on whether accessing by column or row is more useful to you.
table = [
  [4, 9, 2],
  [1, 1, 1],
  [3, 5, 5],
  [3, 3, 2],
  [7, 8, 9],
]

row = 4  # reversed
col = 2  # reversed

>>> table[col]
[3, 5, 5]

>>> table[col][row]
9
Nothing about this data structure enforces equal row or column lengths — one row can be 5 elements long, another 200. Inconsistencies can lead to unexpected errors on the table view. See the alternative data stores later if you're working with large or complex data tables.
Next we'll look in a bit more detail at our custom TableModel and see how it works with this simple data structure to display the values.
Also available from Leanpub and Amazon Paperback
Purchasing Power Parity
Developers in [[ country ]] get [[ discount.discount_pc ]]% OFF on all books & courses with code [[ discount.coupon_code ]]Writing a custom QAbstractTableModel
In the Model View Architecture the model is responsible for providing both the data and presentation metadata for display by the view. In order to interface between our data object and the view we need to write our own custom model, which understands the structure of our data.
To write our custom model we can create a subclass of QAbstractTableModel. The only required methods for a custom table model are data, rowCount and columnCount. The first returns data (or presentation information) for given locations in the table, while the latter two must return a single integer value for the dimensions of the data source.
class TableModel(QtCore.QAbstractTableModel):

    def __init__(self, data):
        super(TableModel, self).__init__()
        self._data = data

    def data(self, index, role):
        if role == Qt.DisplayRole:
            # See below for the nested-list data structure.
            # .row() indexes into the outer list,
            # .column() indexes into the sub-list
            return self._data[index.row()][index.column()]

    def rowCount(self, index):
        # The length of the outer list.
        return len(self._data)

    def columnCount(self, index):
        # The following takes the first sub-list, and returns
        # the length (only works if all rows are an equal length)
        return len(self._data[0])
QtCore.QAbstractTableModel is an abstract base class meaning it does not have implementations for the methods. If you try and use it directly, it will not work. You must sub-class it.
In the __init__ constructor we accept a single parameter data which we store as the instance attribute self._data so we can access it from our methods. The passed in data structure is stored by reference, so any external changes will be reflected here.
To notify the model of changes you need to trigger the model's layoutChanged signal, using self.model.layoutChanged.emit(). See the previous ModelView tutorial for more information.
The data method is called with two values index and role. The index parameter gives the location in the table for which information is currently being requested, and has two methods .row() and .column() which give the row and column number in the view respectively. In our example the data is stored as a nested list, and the row and column indices are used to index as follows data[row][column].
The view has no knowledge of the structure of the source data, and is the responsibility of the model to translate between the view's row and column and the relevant positions in your own data store.
The role parameter describes what kind of information the method should return on this call. To get the data to display the view calls this model method with the role of Qt.DisplayRole. However, role can have many other values including Qt.BackgroundRole, Qt.CheckStateRole, Qt.DecorationRole, Qt.FontRole, Qt.TextAlignmentRole and Qt.ForegroundRole, which each expect particular values in response (see later).
Qt.DisplayRole actually expects a string to be returned, although other basic Python types including float, int and bool will also be displayed using their default string representations. However, formatting these types to your strings is usually preferable.
Basic QTableView example
We'll cover how to use these other role types later, for now it is only necessary to know that you must check the role type is Qt.DisplayRole before returning your data for display.
The two custom methods columnCount and rowCount return the number of columns and rows in our data structure. In the case of a nested list of list in the arrangement we're using here, the number of rows is simply the number of elements in the outer list, and the number of columns is the number of elements in one of the inner lists — assuming they are all equal.
If these methods return values that are too high you will see out of bounds errors, if they return values that are too low, you'll see the table cut off.
Formatting numbers and dates
The data returned by the model for display is expected to be a string. While int and float values will also be displayed, using their default string representation, complex Python types will not. To display these, or to override the default formatting of float , int or bool values, you must format these to strings yourself.
You might be tempted to do this by converting your data to a table of strings in advance. However, by doing this you make it very difficult to continue working with the data in your table, whether for calculations or for updates.
Instead, you should use the model's data method to perform the string conversion on demand. By doing this you can continue to work with the original data, yet have complete control over how it is presented to the user — including changing this on the fly while through configuration.
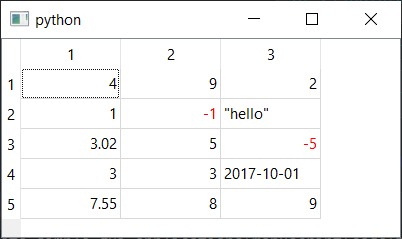
Below is a simple custom formatter which looks up the values in our data table, and displays them in a number of different ways depending on the Python type of the data.
def data(self, index, role):
    if role == Qt.DisplayRole:
        # Get the raw value
        value = self._data[index.row()][index.column()]

        # Perform per-type checks and render accordingly.
        if isinstance(value, datetime):
            # Render time to YYY-MM-DD.
            return value.strftime("%Y-%m-%d")

        if isinstance(value, float):
            # Render float to 2 dp
            return "%.2f" % value

        if isinstance(value, str):
            # Render strings with quotes
            return '"%s"' % value

        # Default (anything not captured above: e.g. int)
        return value
Use this together with the modified sample data below to see it in action.
data = [
    [4, 9, 2],
    [1, -1, 'hello'],
    [3.023, 5, -5],
    [3, 3, datetime(2017,10,1)],
    [7.555, 8, 9],
]
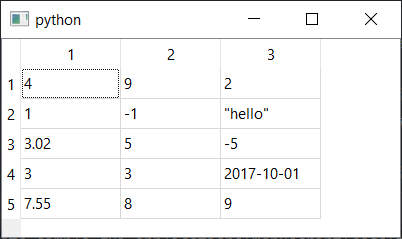 QTableView data formatting
So far we've only looked at how we can customize how the data itself is formatted. However, the model interface gives you far more control over the display of table cells including colors and icons. In the next part we'll look at how to use the model to customise QTableView appearance.
Styles & Colours with Roles
Using colors and icons to highlight cells in data tables can help make data easier to find and understand, or help users to select or mark data of interest. Qt allows for complete control of all of these from the model, by responding to the relevant role on the data method.
The types expected to be returned in response to the various role types are shown below.
| Role | Type |
|---|---|
Qt.BackgroundRole |
QBrush (also QColor) |
Qt.CheckStateRole |
Qt.CheckState |
Qt.DecorationRole |
QIcon, QPixmap, QColor |
Qt.DisplayRole |
QString (also int, float, bool) |
Qt.FontRole |
QFont |
Qt.SizeHintRole |
QSize |
Qt.TextAlignmentRole |
Qt.Alignment |
Qt.ForegroundRole |
QBrush (also QColor)= |
By responding to a particular combination of role and index we can modify the appearance of particular cells, columns or rows in the table — for example, setting a blue background for all cells in the 3rd column.
def data(self, index, role):
    # existing `if role == Qt.DisplayRole:` block hidden
    # hidden for clarity.

    if role == Qt.BackgroundRole and index.column() == 2:
        # See below for the data structure.
        return QtGui.QColor('blue')
By using the index to lookup values from our own data, we can also customise appearance based on values in our data. We'll go through some of the more common use-cases below.
Text alignment
In our previous formatting examples we had used text formatting to display float down to 2 decimal places. However, it's also common when displaying numbers to right-align them, to make it easier to compare across lists of numbers. This can be accomplished by returning Qt.AlignRight in response to Qt.TextAlignmentRole for any numeric values.
The modified data method is shown below. We check for role == Qt.TextAlignmentRole and look up the value by index as before, then determine if the value is numeric. If it is we can return Qt.AlignVCenter + Qt.AlignRight to align in the middle vertically, and on the right horizontally.
def data(self, index, role):
    # existing `if role == Qt.DisplayRole:` block hidden
    # hidden for clarity.

    if role == Qt.TextAlignmentRole:
        value = self._data[index.row()][index.column()]

        if isinstance(value, int) or isinstance(value, float):
            # Align right, vertical middle.
            return Qt.AlignVCenter + Qt.AlignRight
Other alignments are possible, including Qt.AlignHCenter to align centre horizontally. You can combine them together by adding them together e.g. Qt.AlignBottom + Qt.AlignRight.
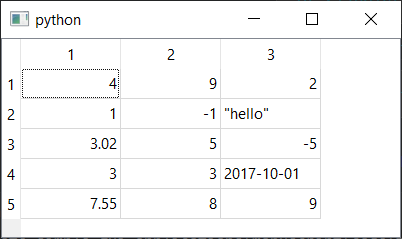 QTableView cell alignment
Text colors
If you've used spreadsheets like Excel you might be familiar with the concept of conditional formatting. These are rules you can apply to cells (or rows, or columns) which change text and background colors of cells depending on their value.
This can be useful to help visualise data, for example using red for negative numbers or highlighting ranges of numbers (e.g. low … high) with a gradient of blue to red.
First, the below example implements a Qt.ForegroundRole handler which checks if the value in the indexed cell is numeric, and below zero. If it is, then the handler returns the text (foreground) color red.
def data(self, index, role):
    # existing `if role == Qt.DisplayRole:` block hidden
    # hidden for clarity.

    if role == Qt.ForegroundRole:
        value = self._data[index.row()][index.column()]

        if (
            (isinstance(value, int) or isinstance(value, float))
            and value < 0
        ):
            return QtGui.QColor('red')
If you add this to your model's data handler, all negative numbers will now appear red.
 QTableView text formatting, with red negative numbers
Number range gradients
The same principle can be used to apply gradients to numeric values in a table to, for example, highlight low and high values. First we define our color scale, which is taken from colorbrewer2.org.
COLORS = ['#053061', '#2166ac', '#4393c3', '#92c5de', '#d1e5f0', '#f7f7f7', '#fddbc7', '#f4a582', '#d6604d', '#b2182b', '#67001f']
Next we define our custom handler, this time for Qt.BackgroundRole. This takes the value at the given index, checks that this is numeric then performs a series of operations to constrain it to the range 0…10 required to index into our list.
def data(self, index, role):
    # existing `if role == Qt.DisplayRole:` block hidden
    # hidden for clarity.

    if role == Qt.BackgroundRole:
        value = self._data[index.row()][index.column()]
        if (isinstance(value, int) or isinstance(value, float)):
            value = int(value)  # Convert to integer for indexing.

            # Limit to range -5 ... +5, then convert to 0..10
            value = max(-5, value) # values < -5 become -5
            value = min(5, value)  # valaues > +5 become +5
            value = value + 5     # -5 becomes 0, +5 becomes + 10

            return QtGui.QColor(colors[value])
The logic used here for converting the value to the gradient is very basic, cutting off high/low values, and not adjusting to the range of the data. However, you can adapt this as needed, as long as the end result of your handler is to return a QColor or QBrush
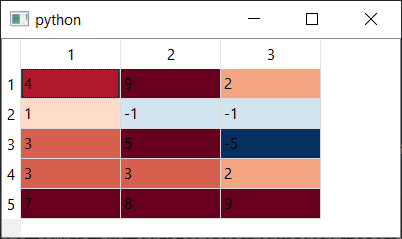 QTableView with number-range color gradients
Icon & Image decoration
Each table cell contains a small decoration area which can be used to display icons, images or a solid block of color, on the left hand side next to the data. This can be used to indicate data type, e.g. calendars for dates, ticks and crosses for bool values, or for a more subtle conditional-formatting for number ranges.
Below are some simple implementations of these ideas.
Indicating bool/date data types with icons
For dates we'll use Python's built-in datetime type. First, add the following import to the top of your file to import this type.
from datetime import datetime
Then, update the data (set in the MainWindow.__init__) to add datetime and bool (True or False values), for example.
data = [
    [True, 9, 2],
    [1, 0, -1],
    [3, 5, False],
    [3, 3, 2],
    [datetime(2019, 5, 4), 8, 9],
]
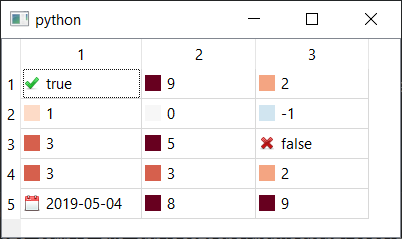
With these in place, you can update your model data method to show icons and formatted dates for date types, with the following.
#  icons indicating data type

def data(self, index, role):
    if role == Qt.DisplayRole:
        value = self._data[index.row()][index.column()]
        if isinstance(value, datetime):
            return value.strftime('%Y-%m-%d')

        return value

    if role == Qt.DecorationRole:
        value = self._data[index.row()][index.column()]
        if isinstance(value, datetime):
            return QtGui.QIcon('calendar.png')
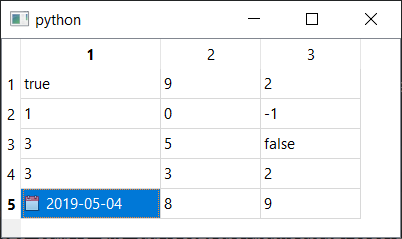 QTableView formatted dates with indicator icon
The following shows how to use ticks and cross for boolean True and False values respectively.
# ticks and crosses for `bool`values
def data(self, index, role):
    # existing `if role == Qt.DisplayRole:` block hidden
    # hidden for clarity.

    if role == Qt.DecorationRole:
        value = self._data[index.row()][index.column()]
        if isinstance(value, bool):
            if value:
                return QtGui.QIcon('tick.png')

            return QtGui.QIcon('cross.png')
You can of course combine the above together, or any other mix of Qt.DecorationRole and Qt.DisplayRole handlers. It's usually simpler to keep each type grouped under the same role if branch, or as your model becomes more complex, to create sub-methods to handle each role.
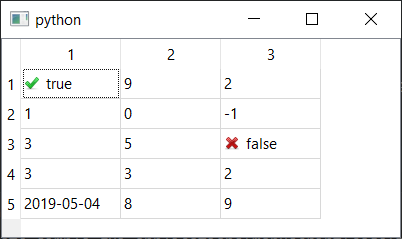 QTableView boolean indicators
Colour blocks
If you return a QColor for Qt.DecorationRole a small square of color will be displayed on the left hand side of the cell, in the icon location. This is identical to the earlier Qt.BackgroundRole conditional formatting example, except now handling and responding to Qt.DecorationRole.
# color blocks
if role == Qt.DecorationRole:
    value = self._data[index.row()][index.column()]
    if (isinstance(value, int) or isinstance(value, float)):
        value = int(value)

        # Limit to range -5 ... +5, then convert to 0..10
        value = max(-5, value)  # values < -5 become -5
        value = min(5, value)   # valaues > +5 become +5
        value = value + 5       # -5 becomes 0, +5 becomes + 10

        return QtGui.QColor(COLORS[value])
 QTableView color block decorations
Alternative Python data structures
So far in our examples we've used simple nested Python lists to hold our data for display. This is fine for simple tables of data, however if you're working with large data tables there are some other better options in Python, which come with additional benefits. In the next parts we'll look at two Python data table libraries — numpy and pandas — and how to integrate these with Qt.
Numpy
Numpy is a library which provides support for large multi-dimensional arrays or matrix data structures in Python. The efficient and high-performance handling of large arrays makes numpy ideal for scientific and mathematical applications. This also makes numpy arrays an good data store for large, single-typed, data tables in PySide.
Using numpy as a data source
To support numpy arrays we need to make a number of changes to the model, first modifying the indexing in the data method, and then changing the row and column count calculations for rowCount and columnCount.
The standard numpy API provides element-level access to 2D arrays, by passing the row and column in the same slicing operation, e.g. _data[index.row(), index.column()]. This is more efficient than indexing in two steps, as for the list of list examples.
In numpy the dimensions of an array are available through .shape which returns a tuple of dimensions along each axis in turn. We get the length of each axis by selecting the correct item from this tuple, e.g. _data.shape[0] gets the size of the first axis.
The following complete example shows how to display a numpy array using Qt's QTableView via a custom model.
import sys
from PySide2 import QtCore, QtGui, QtWidgets
from PySide2.QtCore import Qt
import numpy as np


class TableModel(QtCore.QAbstractTableModel):

    def __init__(self, data):
        super(TableModel, self).__init__()
        self._data = data

    def data(self, index, role):
        if role == Qt.DisplayRole:
            # Note: self._data[index.row()][index.column()] will also work
            value = self._data[index.row(), index.column()]
            return str(value)

    def rowCount(self, index):
        return self._data.shape[0]

    def columnCount(self, index):
        return self._data.shape[1]


class MainWindow(QtWidgets.QMainWindow):

    def __init__(self):
        super().__init__()

        self.table = QtWidgets.QTableView()

        data = np.array([
          [1, 9, 2],
          [1, 0, -1],
          [3, 5, 2],
          [3, 3, 2],
          [5, 8, 9],
        ])

        self.model = TableModel(data)
        self.table.setModel(self.model)

        self.setCentralWidget(self.table)


app=QtWidgets.QApplication(sys.argv)
window=MainWindow()
window.show()
app.exec_()
While simple Python types such as int and float are displayed without converting to strings, numpy uses it's own types (e.g. numpy.int32) for array values. In order for these to be displayed we must first convert them to strings.
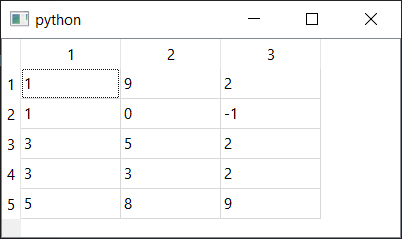 QTableView with numpy array
With QTableView only 2D arrays can be displayed, however if you have a higher dimensional data structure you can combine the QTableView with a tabbed or scrollbar UI, to allow access to and display of these higher dimensions.
Pandas
Pandas is a Python library commonly used for data manipulation and analysis. It provides a nice API for loading 2D tabular data from various data sources and performing data analysis on it. By using the pandas DataTable as your QTableView model you can use these APIs to load and analyse your data from right within your application.
Using Pandas as a data source
The modifications of the model to work with pandas are fairly minor, requiring changes to the indexing in the data method and modifications to rowCount and columnCount. The changes for rowCount and columnCount are identical to numpy with pandas using a _data.shape tuple to represent the dimensions of the data.
For indexing we use the pandas .iloc method, for indexed locations — i.e. lookup by column and/or row index. This is done by passing the row, and then column to the slice _data.iloc[index.row(), index.column()] .
The following complete example shows how to display a pandas data frame using Qt QTableView via a custom model.
import sys
from PySide2 import QtCore, QtGui, QtWidgets
from PySide2.QtCore import Qt
import pandas as pd


class TableModel(QtCore.QAbstractTableModel):

    def __init__(self, data):
        super(TableModel, self).__init__()
        self._data = data

    def data(self, index, role):
        if role == Qt.DisplayRole:
            value = self._data.iloc[index.row(), index.column()]
            return str(value)

    def rowCount(self, index):
        return self._data.shape[0]

    def columnCount(self, index):
        return self._data.shape[1]

    def headerData(self, section, orientation, role):
        # section is the index of the column/row.
        if role == Qt.DisplayRole:
            if orientation == Qt.Horizontal:
                return str(self._data.columns[section])

            if orientation == Qt.Vertical:
                return str(self._data.index[section])


class MainWindow(QtWidgets.QMainWindow):

    def __init__(self):
        super().__init__()

        self.table = QtWidgets.QTableView()

        data = pd.DataFrame([
          [1, 9, 2],
          [1, 0, -1],
          [3, 5, 2],
          [3, 3, 2],
          [5, 8, 9],
        ], columns = ['A', 'B', 'C'], index=['Row 1', 'Row 2', 'Row 3', 'Row 4', 'Row 5'])

        self.model = TableModel(data)
        self.table.setModel(self.model)

        self.setCentralWidget(self.table)


app=QtWidgets.QApplication(sys.argv)
window=MainWindow()
window.show()
app.exec_()
An interesting extension here is to use the table header of the QTableView to display row and pandas column header values, which can be taken from DataFrame.index and DataFrame.columns respectively.
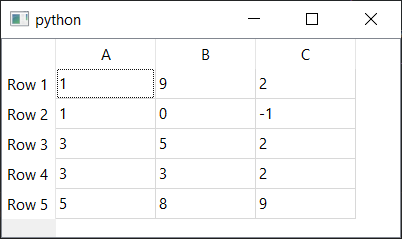 QTableView pandas DataTable, with column and row headers
For this we need to implement a Qt.DisplayRole handler in a custom headerData method. This receives section, the index of the row/column (0…n), orientation which can be either Qt.Horizontal for the column headers, or Qt.Vertical for the row headers, and role which works the same as for the data method.
The headerData method also receives other roles, which can be used to customise the appearance of the headers further.
Packaging Python Applications with PyInstaller by Martin Fitzpatrick — This step-by-step guide walks you through packaging your own Python applications from simple examples to complete installers and signed executables.
Conclusion
In this tutorial we've covered the basics of using QTableView and a custom model to display tabular data in your applications. This was extended to demonstrate how to format data and decorate cells with icons and colors. Finally, we demonstrated using QTableView with tabular data from numpy and pandas data structures, including displaying custom column and row headers.
